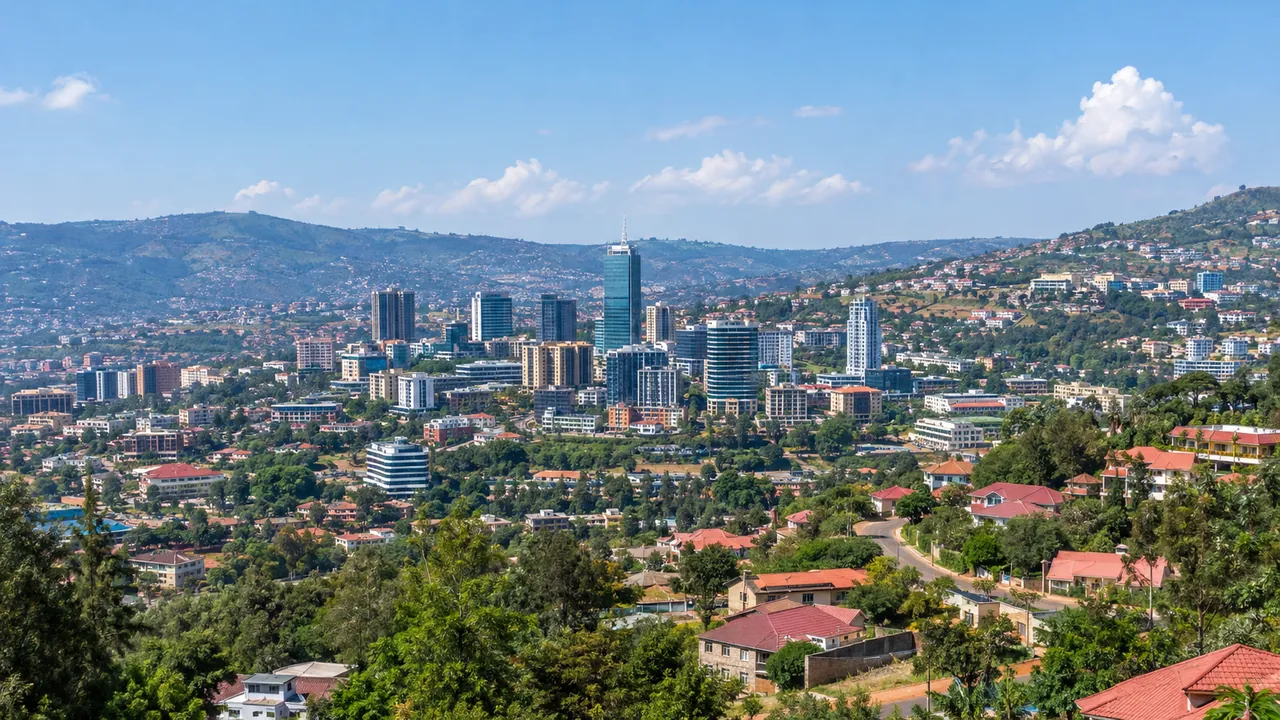
Kigali Property Prices by Area
The official reference prices
The land reference prices are published by the Institute of Real Property Valuers in Rwanda (IRPV) in the Official Gazette. They give a minimum, average and maximum price per m² for land in each sector and cell of the country. Valuers, banks, courts and the Government use them for valuations, expropriation and taxes, and valuers mostly use the maximum.
The current list dates from 1 December 2021. IRPV has prepared a new one, and in September 2026 it was still waiting for Cabinet approval. Until then the official prices are well below what land sells for.
Official prices against the market
| Area | Official price per m² | Market price per m² |
|---|---|---|
| Kacyiru, Rugando cell (Gasabo, Kigali) | Maximum RWF 79,000 | More than RWF 200,000 |
| Bugesera District | RWF 2,600 | About RWF 26,000 |
These are examples reported by The New Times, not a full market survey. They show why a buyer should not rely on the official list alone, and why a bank’s valuation can come in below the asking price.
Kigali’s land tax bands
Land tax in Kigali gives another official view of how the city is priced. A Ministerial Order of November 2023 sets bands per m² a year by zone and use, and the City Council picks the rate for each area within them.
| Zone | Residential | Commercial and industrial |
|---|---|---|
| City centre | RWF 60–80 | RWF 70–80 |
| Suburbs | RWF 40–60 | RWF 50–70 |
| Edge of the city | RWF 10–40 | RWF 20–50 |
Kigali’s three districts
| District | Main areas |
|---|---|
| Gasabo | Nyarutarama, Kacyiru, Kimihurura, Remera, Kimironko, Kibagabaga, Gacuriro, Kinyinya |
| Kicukiro | Niboye, Kagarama, Gahanga, Masaka, Kanombe |
| Nyarugenge | The city centre, Kiyovu, Nyamirambo |
Prices differ more between cells than between districts, so compare like with like: a plot in Nyarutarama and one at the edge of Gasabo fall in different land tax zones. The Kigali Master Plan 2050 decides what can be built on each plot, so check the zoning before you compare prices.
How to check a price
- Look up the plot’s official reference price with IRPV.
- Check its zoning on the Kigali Master Plan portal.
- Ask a registered valuer for a market valuation; a bank will ask for one anyway.
- Compare recent sales in the same cell, not asking prices on listing sites.
Prices also move with inflation. Housing, water and electricity prices were up 20.4% in the year to August 2026, and urban consumer prices 17.2% in the year to September.
Frequently Asked Questions
Are there official property prices in Kigali?
There are official land reference prices per m², last set in 2021 and still awaiting an update. They sit well below market prices.
How far below the market are the official prices?
In Kacyiru the official maximum is RWF 79,000 per m², against more than RWF 200,000 in the market.
What is the land tax in Kigali?
RWF 10 to 80 per m² a year, by zone and use.
Sources
- Institute of Real Property Valuers: Land reference prices
- allAfrica (The New Times): New land reference prices await Cabinet approval, September 2026
- The New Times: Why updating Rwanda’s land price reference list cannot wait
- allAfrica (The New Times): Kigali land tax rates by zone, January 2026
- National Institute of Statistics of Rwanda: Consumer price index, August 2026 (PDF)
- allAfrica (The New Times): Land reference prices and the market, March 2026
- City of Kigali: City of Kigali launches new Master Plan 2050
- City of Kigali: Kigali Master Plan 2050 portal
- National Institute of Statistics of Rwanda: Consumer price index 2026
Figures checked 9 November 2026. Prepared by InvestRwanda.com for general information. It is not investment, tax or legal advice; please confirm details with a qualified adviser before acting.