Skip to content
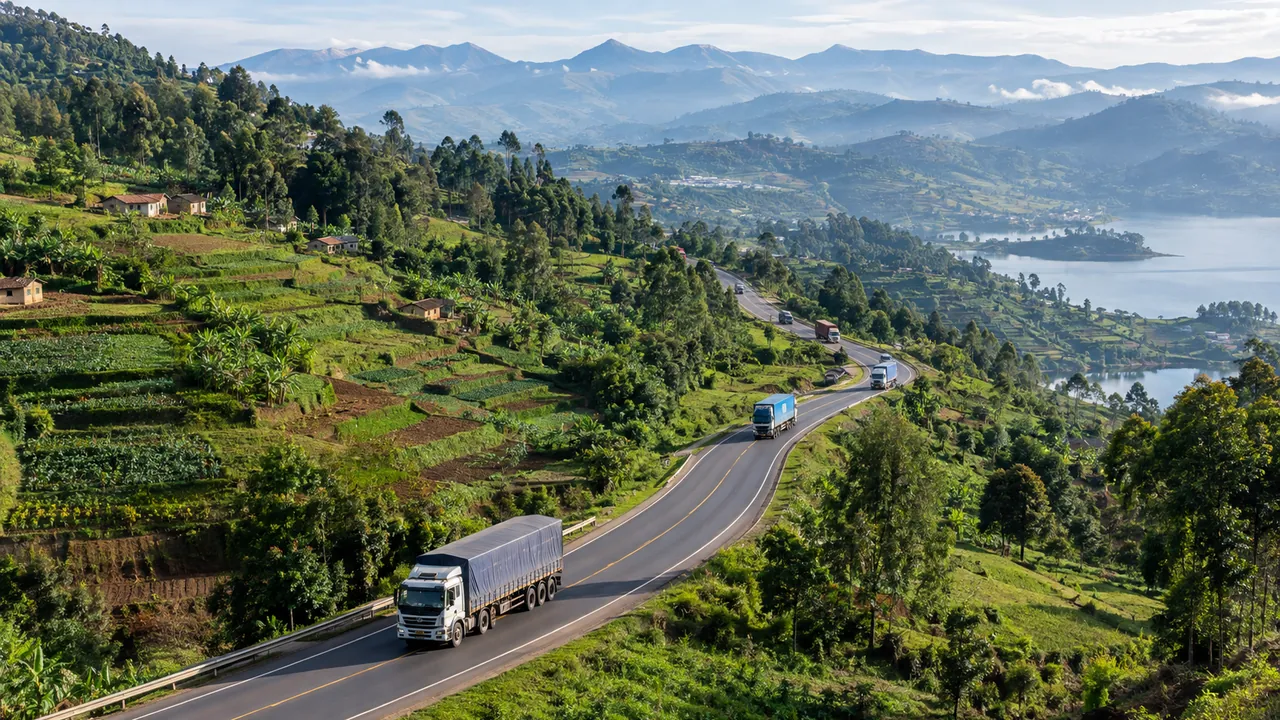
Trucks on a winding highway through Rwanda’s terraced hills

Investor guides

Rwanda Economy in Charts

The figures investors ask about most, read automatically from the World Bank’s open data so they stay current.

What the figures mean for investors: Why Rwanda.

Growth

Real GDP growth

% change on the previous year, in constant prices

Rwanda, 2025
9.4%
Sub-Saharan Africa, 2025
4.1%

Source: World Bank, World Development Indicators (NY.GDP.MKTP.KD.ZG), updated 8 Oct 2026

Show the figures
Real GDP growth, % change on the previous year, in constant prices
YearRwandaSub-Saharan Africa
20259.4%4.1%
20247.2%3.6%
20238.6%2.7%
20229.8%4.0%
20218.4%3.6%
2020−2.8%−3.3%
20199.3%2.6%
20188.1%2.8%
20174.7%2.5%
20165.7%1.3%
20158.9%2.9%
20145.7%4.7%
20134.7%5.3%
20128.6%3.3%

Size of the economy

GDP in US$ billion, current prices

Rwanda, 2025
US$16.4bn

Source: World Bank, World Development Indicators (NY.GDP.MKTP.CD), updated 8 Oct 2026

Show the figures
Size of the economy, GDP in US$ billion, current prices
YearRwanda
2025US$16.4bn
2024US$15.1bn
2023US$14.8bn
2022US$13.8bn
2021US$11.3bn
2020US$10.5bn
2019US$10.5bn
2018US$9.7bn
2017US$9.2bn
2016US$8.6bn
2015US$8.5bn
2014US$8.1bn
2013US$7.7bn
2012US$7.6bn
2011US$6.8bn
2010US$6.1bn
2009US$5.6bn
2008US$5.1bn
2007US$4.0bn
2006US$3.3bn
2005US$2.9bn

GDP per person

US$ per person, current prices

Rwanda, 2025
US$1,124
Sub-Saharan Africa, 2025
US$1,673

Source: World Bank, World Development Indicators (NY.GDP.PCAP.CD), updated 8 Oct 2026

Show the figures
GDP per person, US$ per person, current prices
YearRwandaSub-Saharan Africa
2025US$1,124US$1,673
2024US$1,060US$1,543
2023US$1,061US$1,682
2022US$1,007US$1,865
2021US$843US$1,786
2020US$803US$1,628
2019US$823US$1,797
2018US$773US$1,623
2017US$751US$1,549
2016US$721US$1,457
2015US$726US$1,647
2014US$715US$1,908
2013US$695US$1,880
2012US$698US$1,818
2011US$643US$1,796
2010US$587US$1,643
2009US$557US$1,428
2008US$522US$1,537
2007US$421US$1,391
2006US$352US$1,235
2005US$324US$1,074

Prices

Inflation

Consumer prices, % change on the previous year

Rwanda, 2025
5.9%
Sub-Saharan Africa, 2025
3.4%

Source: World Bank, World Development Indicators (FP.CPI.TOTL.ZG), updated 8 Oct 2026

Show the figures
Inflation, Consumer prices, % change on the previous year
YearRwandaSub-Saharan Africa
20255.9%3.4%
20241.8%4.3%
202319.8%6.7%
202217.7%9.5%
2021−0.4%4.4%
20209.9%3.4%
20193.4%2.9%
2018−0.3%3.9%
20178.3%5.2%
20167.2%5.3%
20152.5%3.5%
20142.4%4.4%
20135.9%4.9%
201210.3%6.6%

People and jobs

Population

Millions, mid-year estimate

Rwanda, 2025
14.6m

Source: World Bank, World Development Indicators (SP.POP.TOTL), updated 8 Oct 2026

Show the figures
Population, Millions, mid-year estimate
YearRwanda
202514.6m
202414.3m
202314.0m
202213.7m
202113.4m
202013.1m
201912.8m
201812.5m
201712.2m
201611.9m
201511.6m
201411.4m
201311.1m
201210.8m
201110.6m
201010.3m
200910.1m
20089.8m
20079.6m
20069.3m
20059.1m

Unemployment rate

% of the labour force, International Labour Organization modelled estimate

Rwanda, 2025
11.4%
Sub-Saharan Africa, 2025
5.7%

Source: World Bank, World Development Indicators (SL.UEM.TOTL.ZS), updated 8 Oct 2026

Show the figures
Unemployment rate, % of the labour force, International Labour Organization modelled estimate
YearRwandaSub-Saharan Africa
202511.4%5.7%
202411.3%5.7%
202312.4%5.8%
202215.1%6.1%
202115.8%6.9%
202011.8%6.7%
201911.2%6.2%
201810.8%6.0%
201711.9%6.0%
201611.8%5.9%
201511.8%5.8%
201411.8%5.6%
201311.8%5.6%
201211.7%5.8%
201111.8%5.9%
201011.6%5.9%

Investment and trade

Foreign direct investment

Net inflows, US$ billion

Rwanda, 2025
US$1.0bn

Source: World Bank, World Development Indicators (BX.KLT.DINV.CD.WD), updated 8 Oct 2026

Show the figures
Foreign direct investment, Net inflows, US$ billion
YearRwanda
2025US$1.0bn
2024US$0.6bn
2023US$0.5bn
2022US$0.3bn
2021US$0.2bn
2020US$0.2bn
2019US$0.3bn
2018US$0.4bn
2017US$0.3bn
2016US$0.3bn
2015US$0.2bn
2014US$0.3bn
2013US$0.2bn
2012US$0.3bn

Exports and imports

Goods and services, US$ billion, current prices

Exports, 2025
US$3.5bn
Imports, 2025
US$5.8bn

Source: World Bank, World Development Indicators (NE.EXP.GNFS.CD), updated 8 Oct 2026

Show the figures
Exports and imports, Goods and services, US$ billion, current prices
YearExportsImports
2025US$3.5bnUS$5.8bn
2024US$4.3bnUS$6.5bn
2023US$3.5bnUS$6.4bn
2022US$3.0bnUS$5.4bn
2021US$2.2bnUS$4.6bn
2020US$2.0bnUS$2.7bn
2019US$2.3bnUS$2.8bn
2018US$2.1bnUS$2.5bn
2017US$1.9bnUS$3.1bn
2016US$1.3bnUS$3.0bn
2015US$1.1bnUS$2.7bn
2014US$1.1bnUS$2.5bn
2013US$1.1bnUS$2.3bn
2012US$0.9bnUS$2.2bn
2011US$0.9bnUS$1.9bn
2010US$0.7bnUS$1.6bn
2009US$0.6bnUS$1.5bn
2008US$0.6bnUS$1.4bn
2007US$0.6bnUS$0.9bn
2006US$0.4bnUS$0.7bn
2005US$0.3bnUS$0.8bn

All figures are from World Bank, World Development Indicators, and the latest year can be revised. Last read on 10 November 2026. Information only, not investment advice.